Skip to content

Projects

Below you can read summaries of my published and ongoing work.

Was there ever an ocean on Mars?

Hughes, C. M., et al., (2019). Deltaic deposits indicative of a paleo-coastline at Aeolis Dorsa, Mars. Icarus317, 442-453.

Located north of Mars’ hemispheric dichotomy, Aeolis Dorsa is home to some of the most extensive preserved river deposits on the surface of Mars. They come in the form of topographically-inverted ridges, and are thought to be over 3.5 billion years old. 

We examined a particular set of stacked branching ridge networks in the southeast Aeolis Dorsa region. Using stereo-photogrammetry, we analyzed superposition relationships and stratigraphic architecture to determine that these branching networks were the preserved remnants of a long-lived river delta system. These results, along with some others nearby, strongly indicate the presence of a large and long-lived standing body of water in the northern lowlands. This is exciting because some hypothesize that the north lowlands on Mars could have been the home to an ocean!
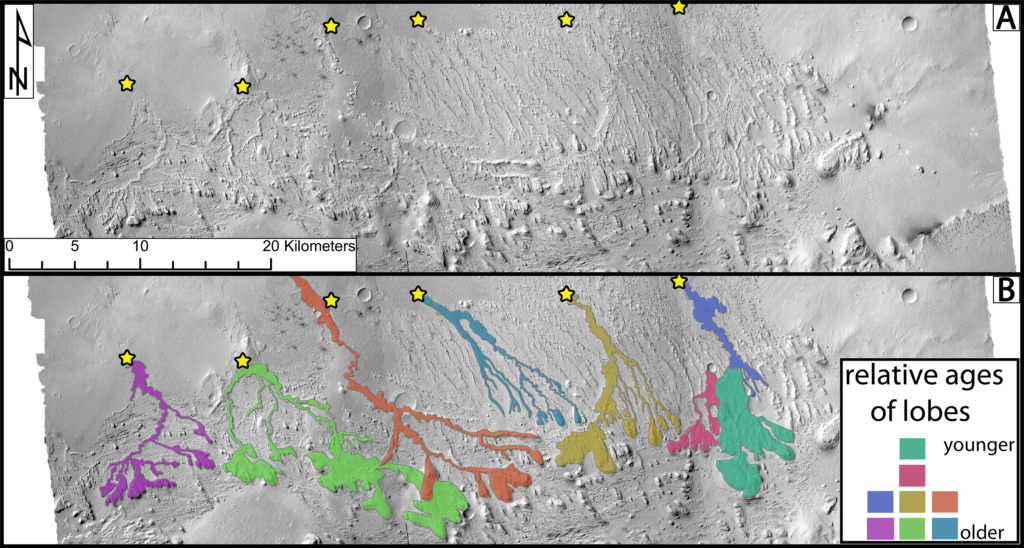
Branching fluvial networks shown uninterpreted in three CTX images in panel A, and interpreted in panel B.

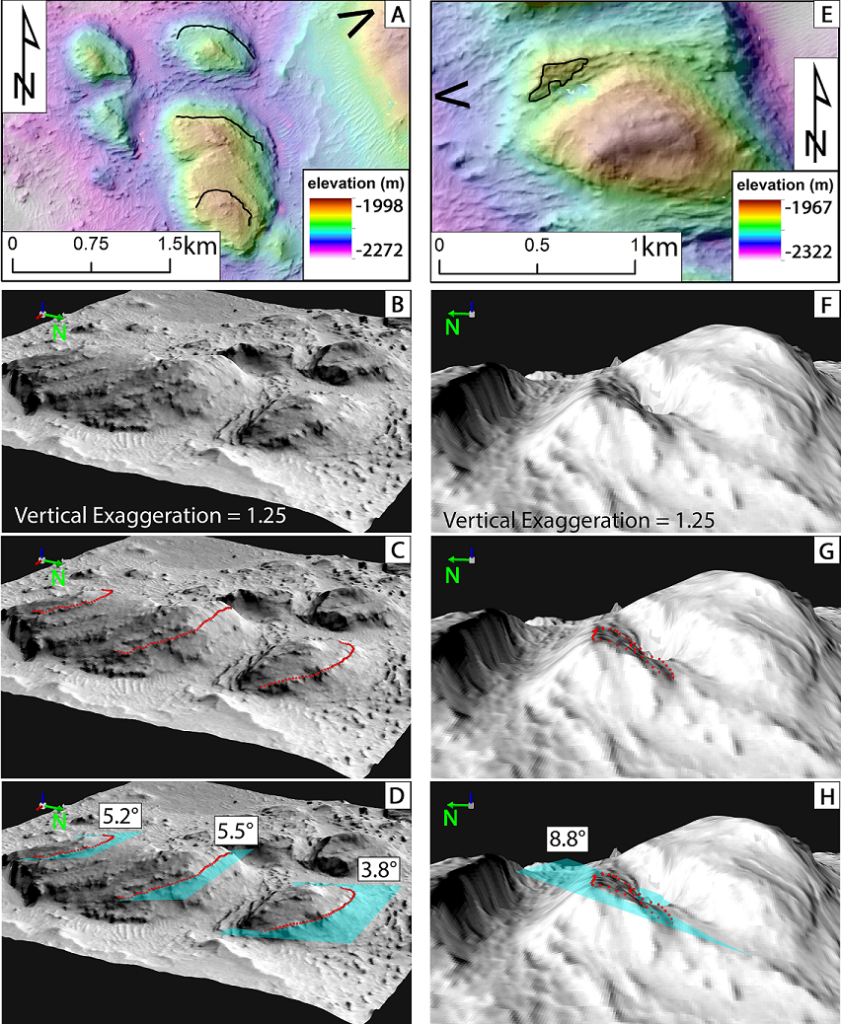
Stratal surfaces were mapped with polylines that were exported as XYZ-point clouds. Planes were fit to the point clouds whose attitude represents the strike and dip of the stratal surfaces. These dipping beds are interpreted to be dipping foresets, an essential line of evidence that points toward a delatic origin for these deposits.

Do rivers on Earth and Mars behave similarly when they get close to coastlines?

Hughes, C. M., et al., (2024). Estimates for Backwater Length of River Delta Deposits at Aeolis Dorsa , Mars. Geophysical Research Letters (submitted).

During my PhD research, I have taken another look at these rocks in Aeolis Dorsa. Using a relationship established for terrestrial deltas by Fernandes et al. (2016), where normalized channel belt widths decrease with proximity to the coast (see below), we noticed they reach a characteristic width range from ~2-5 at one backwater length. The backwater length of a river can be thought of simply as the distance upstream where a river starts to “feel” the presence of a standing body of water at its terminus. For example, the distance upstream of the Gulf Coast that the Mississippi River starts behaving slightly different due to the Gulf of Mexico. For the Mississippi River, the backwater length is ~200km.
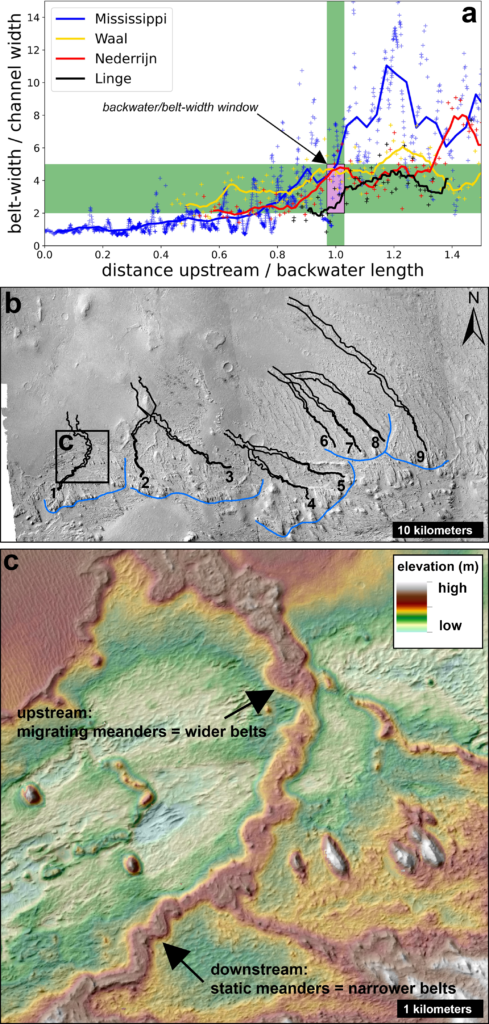
(a) CB width divided by a characteristic channel width (i.e., channel-normalized width) plotted against normalized backwater length for CBs on Earth. Data is from Fernandes et al. (2016). Curves represent boxcar moving averages with a box width of 0.1 backwater lengths. The pink box indicates the backwater/belt-width window which corresponds to roughly one backwater-length upstream and a range of channel-normalized widths that falls between two and five. b) CTX mosaicked map of Southeast Aeolis Dorsa, Mars, with studied CBs numbered. Left and right lateral bounds outlined (black) and putative shorelines mapped (blue). c) CTX orthoimages overlain by corresponding DEMs showing a type-example of a topographically inverted CB. Note the downstream narrowing of the CB which is associated with backwater hydrodynamics (e.g., Fernandes et al., 2016).

We measured the width of sandy river deposits (aka channel belts) on Mars (seen above) and then calculated the backwater length using each backwater/belt-width window (seen below).
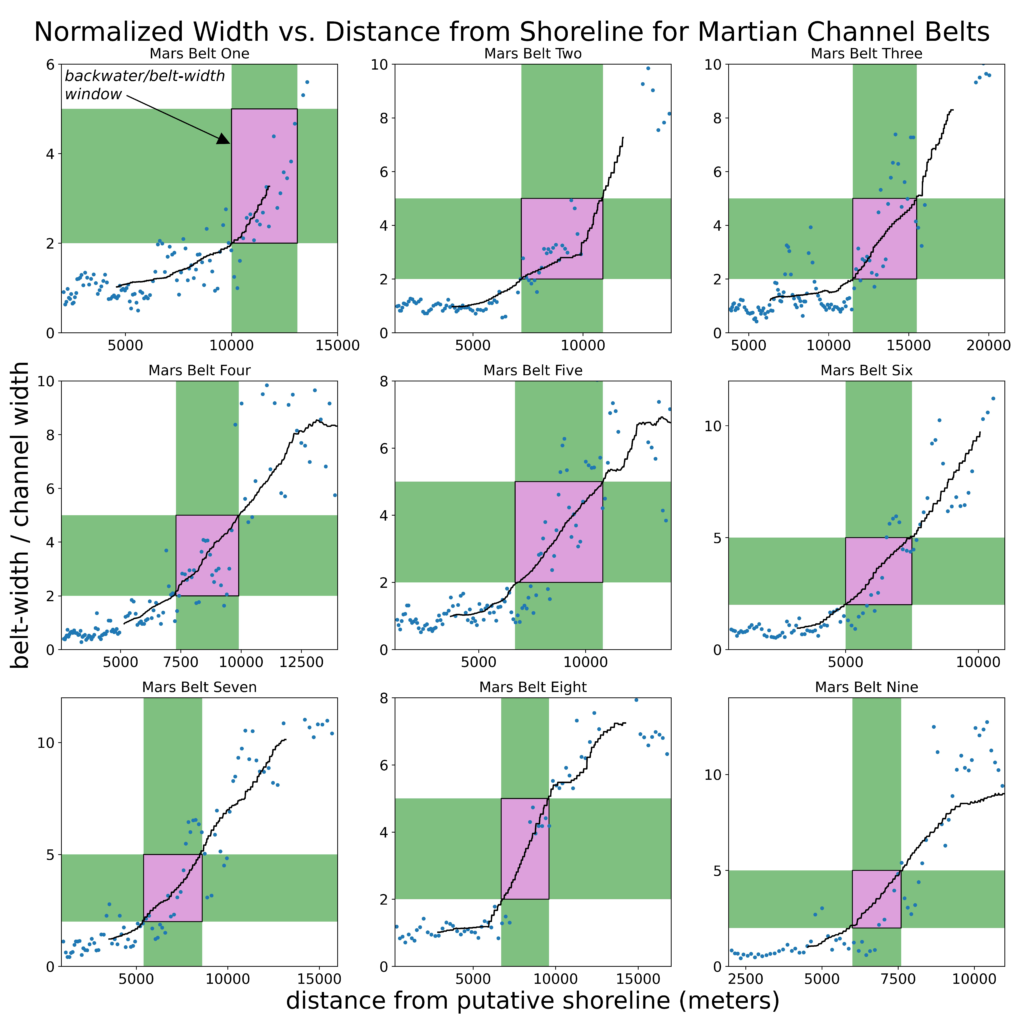
Channel-normalized width and distance from shoreline for the nine measured CBs in Southeast Aeolis Dorsa. Curves represent moving averages with a box width of 5 kilometers. Estimates for backwater length are found using the backwater-width-window – when the average channel-normalized width crosses into the backwater/belt-width window (which is a range from 2 to 5 channel-normalized widths; pink rectangle) a range of distances from the putative shoreline can be found on the x-axis. These distances correspond to an estimate range for the length of the backwater zone for a given CB.

With established values for backwater length, we can then map out how far upstream these rivers on Mars were “feeling” the putative coastline (coastline shown in blue in panel a below and orange shows the start of the backwater zone).
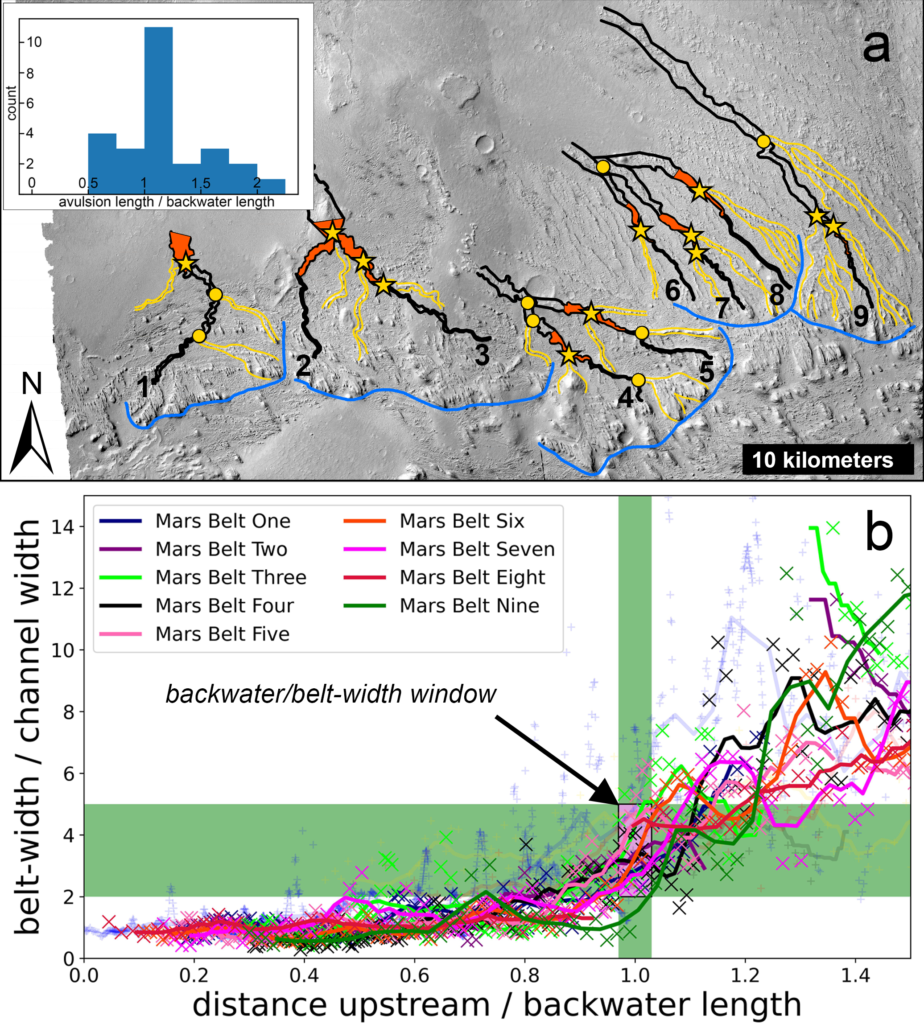
a) Mapped CBs outlined in black and the putative shorelines in blue. Yellow outlines indicate avulsed CB paths. The estimated start of the backwater zone for each CB is shown in orange. Avulsion nodes are marked with gold stars and circles; stars when they fall within the estimated start of the backwater zone, and circles when they fall outside. Histogram shows the avulsion length of identified nodes (stars and circles) in terms of their distance upstream measured in backwater lengths. Note that most nodes are ~1 backwater length upstream. b) Channel-normalized widths vs normalized backwater length for the martian CBs plotted on top of the Earth data (semi-transparent) from Fernandes et al. (2016). Martian belts two, three, and five have breaks in their moving averages due to gaps where measurements of CB boundaries were impossible to delineate.

Part of the reason it is so exciting to have an estimate for backwater length, is that on Mars, estimating grainsize for these river systems is very challenging. Unfortunately, if we want to make any calculations that would allow us to estimate the longevity of these systems, or really anything about their paleo-hydrology, we need a grainsize estimate. Fortunately, from an estimated backwater length, we can get to an estimate for grainsize! So, these new results provide an entirely new method for backing our way into grainsize, which will avail new and refined estimates for how much water was flowing through this system billions of years ago on Mars.


Are there places we can look for life on Mars? Was there ever fresh water?

Hughes, C. M., et al., (2023). Sources of Clay‐Rich Sediment in Eberswalde Crater, Mars With Implications for Biopreservation Potential. Journal of Geophysical Research: Planets128(4), e2022JE007545.

Eberswalde crater is home to one of the most pristinely preserved river deposits on the surface of Mars. The deposit, widely thought to be another ancient deltaic system, has been a perennial contender for rover mission locations during the planning stages.

We took a close look at the minerals in Eberswalde crater, and in the area around it. We found that there was an abundance of clay minerals (Saponite and Nontronite) that form when water interacts with basaltic minerals. These ‘aqueous alteration minerals’ were found in the large plateau to the west (Northwest Noachis Terra), in the drainage basin that leads to the delta, and in the delta itself. Where they outcrop in the plateau, they look like they may have formed from processes similar to how soil forms on Earth. These clay minerals are also potential hosts for biomarkers of past life! Therefore, with sediment containing these minerals being concentrated in the delta, it is possible that there may be evidence of past life in a small, rover-accessible area, in Eberswalde crater!
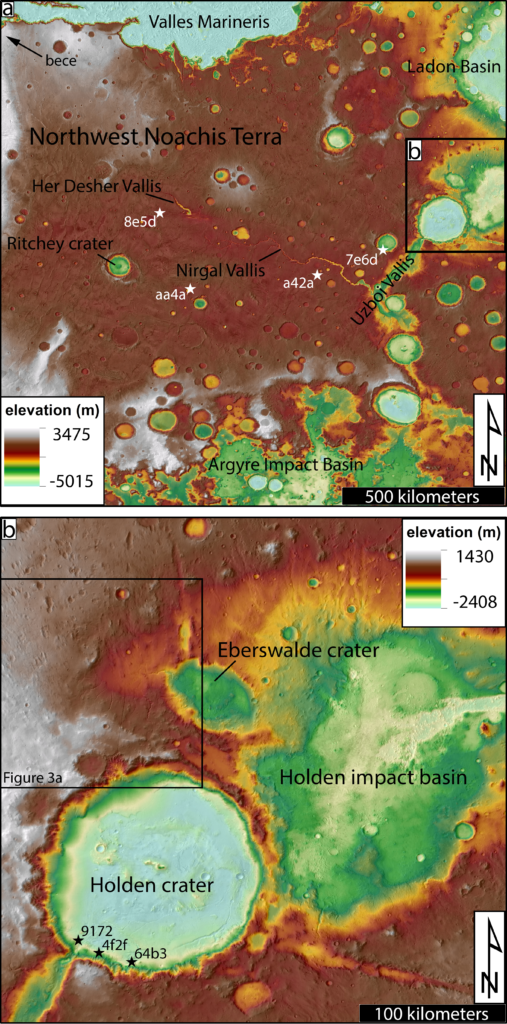
Regional and local context of the study area. (a) Regional context of the study area shown with daytime Thermal Emission Imaging System (THEMIS) data (Christensen et al., 2004; Edwards et al., 2011) with Mars Orbiter Laser Altimeter (MOLA) gridded elevation data (Smith et al., 2001) overlain. Notable geographic features labeled and indicated accordingly. Approximate locations of extracted CRISM spectra from the northwest Noachis Terra plateau labeled with stars and the final four characters of their observation ID (full IDs are listed in Table S1). (b) Same as (a) but for the local context of the Eberswalde crater study area.

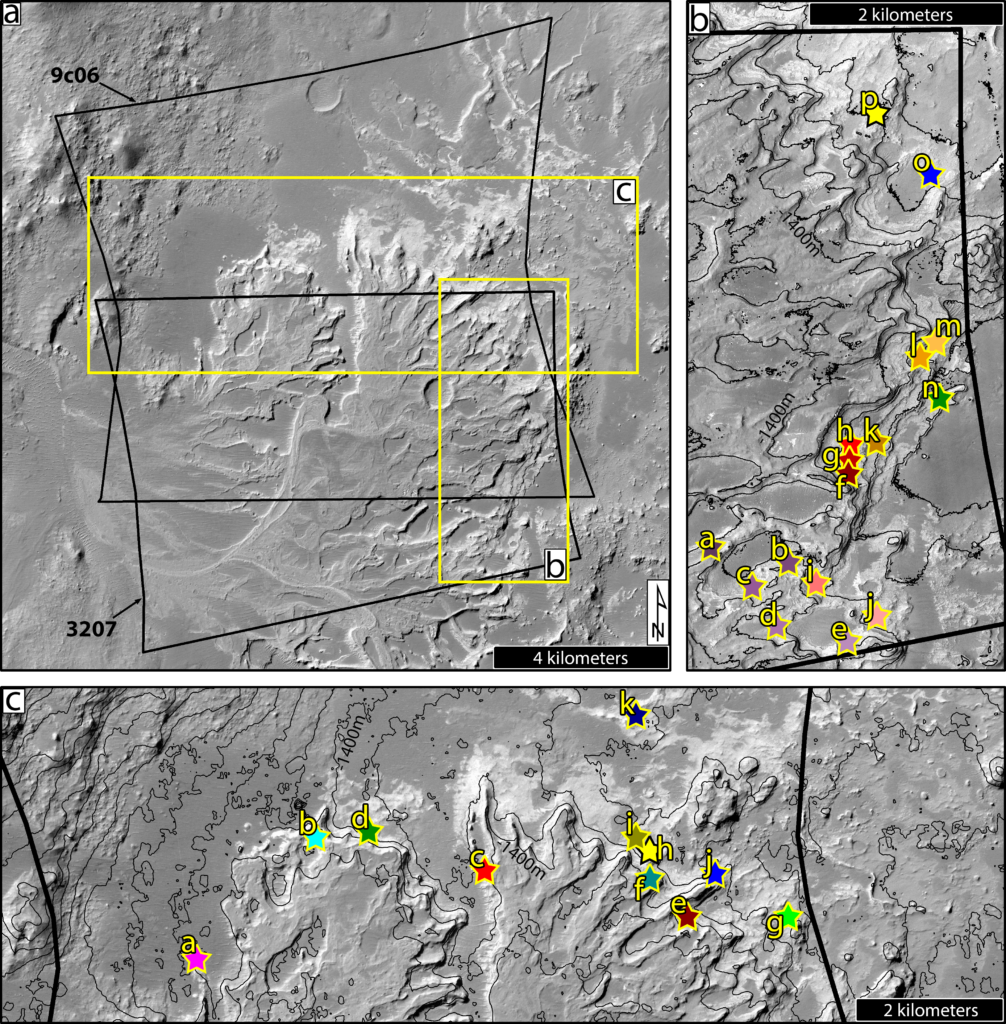
To accomplish these impressive results, we first scoped out the river delta deposits using visual wave-length images of the surface of Mars taken by NASA’s Mars Reconnaissance Orbiter (MRO) seen below. The tiny stars labeled with yellow letters are the spots where we extracted hyperspectral data that was also recovered by the MRO.
Once extracting the hyperspectral data, correcting for atmosphere, sunlight incidence angle, and a few other things, we were able to compare the spectral curves to known minerals we’ve catalogued here on Earth. As it turns out, these bumpy lines are very similar to clay minerals, saponite and nontronite! Viola, there are clays in Eberswalde and the surrounding area.

Since there are clays, there must have been a fresh water lake here at some point in Mars’ history! How cool is that?
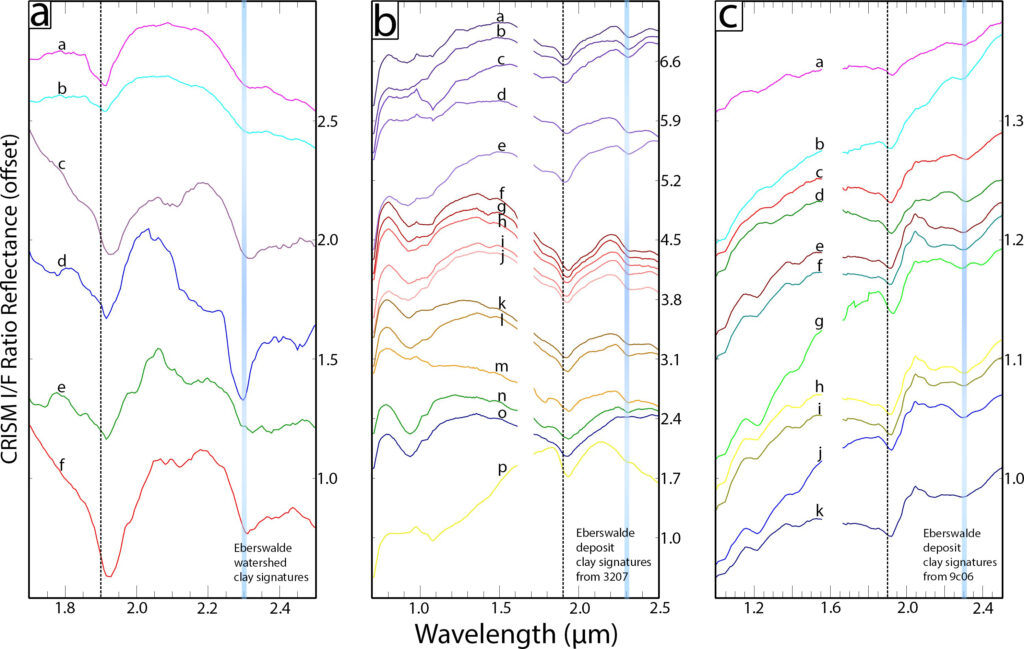
Ratioed and I/F corrected spectra extracted from CRISM observations of the Eberswalde crater fluvial system. Spectra are smoothed using a moving box-car average with the two closest data points on either side of a particular bandpass. Spectra in all plots are offset for clarity, and reflectance values labeled on the right side of each plot are relative. The dashed vertical lines indicate the approximate location of the ~1.9 µm water combination absorption feature. The blue vertically oriented rectangles correspond to the ~2.29-2.32 µm metal-OH absorption feature in Fe/Mg smectite clays. CRISM instrument error is ~1% (Murchie et al., 2007). White gaps in spectra are intentional to obfuscate non-mineralogic instrument artifacts. (a) Spectra extracted from the Eberswalde crater watershed region; letters above each spectra correspond to the approximate location of the ROI shown in Figure 3. (b) Spectra extracted from the Eberswalde delta deposit in CRISM observation hrs00003207; letters above each spectra correspond to the approximate location of the ROI shown in Figure 4. Spectra are ordered in accordance with their stratigraphic position using elevation as a proxy. These spectra are extracted from an MTRDR, so all share a single ratio spectrum. (c) Same as (b) but from CRISM observation frt00009c06.

We also used numerical models to help us in understanding how the impacts that created the nearby craters may have displaced, or spread out, the clays over the local area.
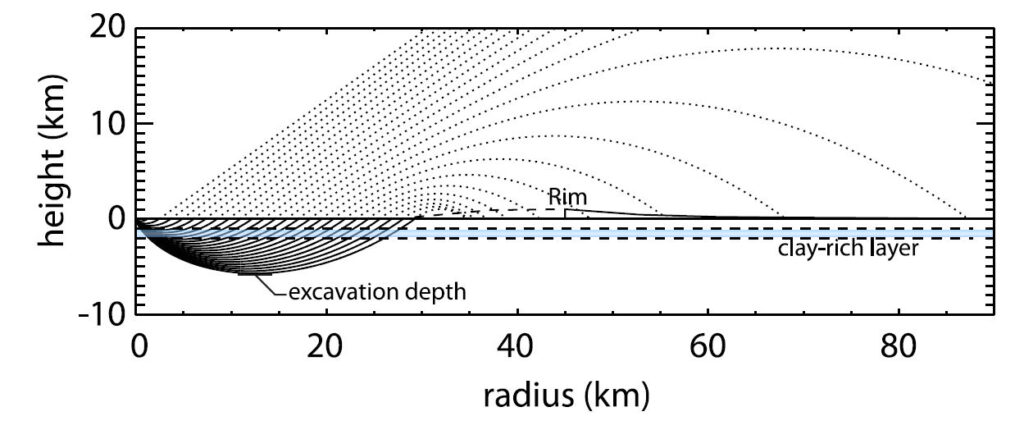
Graphical representation of the modified Maxwell-Z model used in this study for a ~90 km diameter crater (modified from Barnhart and Nimmo, 2011; their Figure 1). The origin represents the center of the crater, and the dotted lines represent the trajectories (stream tubes) of ejected material. The crater rim is labeled, and the blue layer between parallel dashed lines beneath the 0 km height indicates the bounds of a buried clay-rich layer. Stream tubes exiting through the top of the graphic represent material that does not contribute to the emplacement of the impact ejecta deposit.

By calculating the amount of mass ejected from each crater, we were able to model the thickness of their combined ejecta if none of the material had been eroded since the impact events (though we acknowledge this isn’t likely and some erosion has certainly occurred).
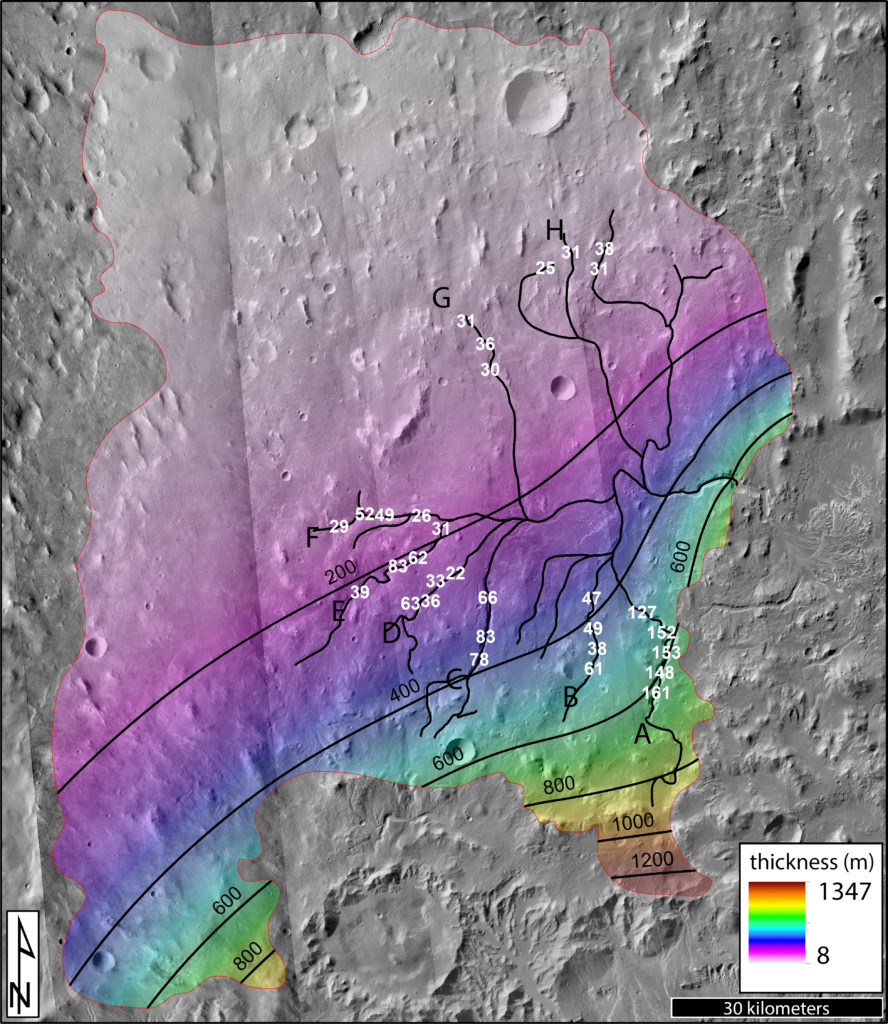
Distribution of modeled cumulative ejecta thickness from both the Eberswalde and the Holden impact events within the bounds of the watershed (Mangold et al., 2012b, thin red line) shown with color scale and contour lines (contour interval is 200 m). Black dendritic pattern represents the tracing of the incised valley network that feeds the delta deposit in Eberswalde crater. Image is a mosaic of day-time THEMIS IT mosaic and CTX images B06_011898_1558, J02_045550_1560, B21_017911_1559, B21_017700_1557, B02_010619_1561, G02_019111_1548, B22_018333_1548, and B02_010263_1557. Incision depth measured values and locations indicated with white text with units of meters, and labeled with capital letters at the head of each. None of the results indicated enough erosion to have incised all the way through the layers of ejecta to reach the pre-impact clay-bearing basement rocks.Measurements were made down the length of the valley and spaced ~2 km apart with a focus on regions which showed the greatest relief in CTX derived DEMs. Results of the measurements are reported in Table S4.

We then measured the depth of the valleys that fed the crater lake to see if the formative rivers had eroded all the way through the layers of ejecta into the deeper rocks using digital elevation models. The results of our measurements indicated that the rivers likely never eroded through the total thickness of the eject in any region of the watershed.

Diagram demonstrating the method for measuring the depth of a valley from a digital elevation model.

What can we learn about the rocks and rivers on Mars from the rocks and rivers we find on Earth?

Cardenas, B. T., Mohrig, D. C., Goudge, T. A., Hughes, C. M., Levy, J., Swanson, T., & Mason, J. (2018, December). Anatomy of exhumed river channel-belts. In AGU Fall Meeting Abstracts.

Hughes, C. M., et al., (2024). The Wedington Sandstone: A Terrestrial Analog for Topographically Inverted River Delta Deposits on Mars. (In preparation).

One of the most difficult challenges planetary scientists face is that most of our datasets come from orbital spacecraft and that the rocks we analyze are very far away. However, planet Earth provides us with an abundance of analogous processes and outcrops by which to compare, and if we can develop a deep understanding of the great detail on Earth then we can expect to gain a more informed understanding of what we observe from orbit on other planets’ surfaces.

Below are some images from central Utah of river deposits very much like what we see from space on the surface of Mars!
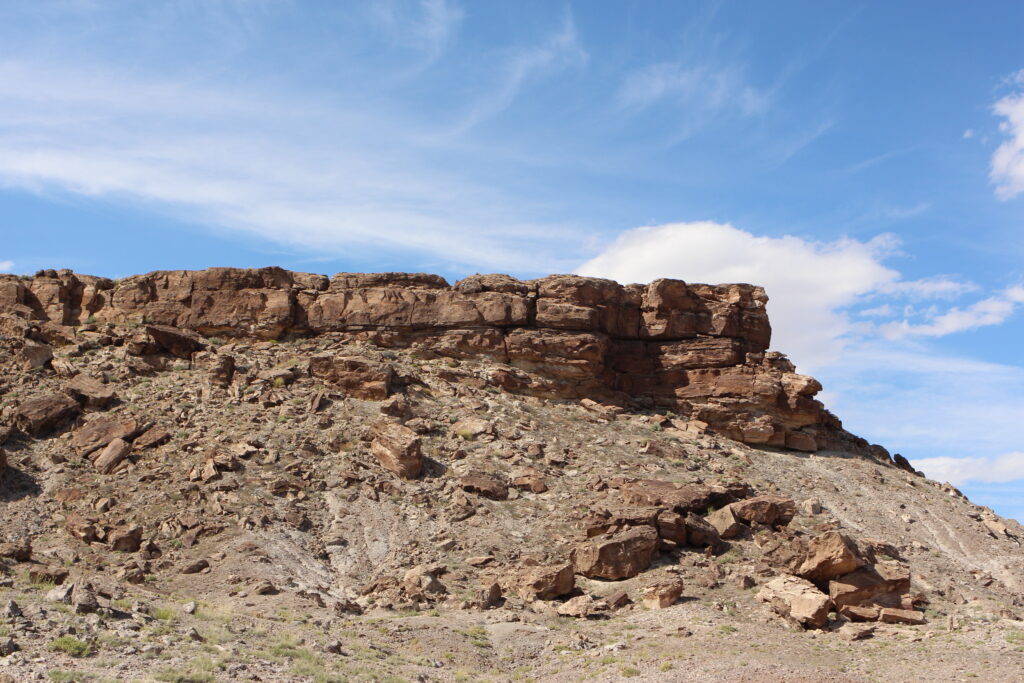
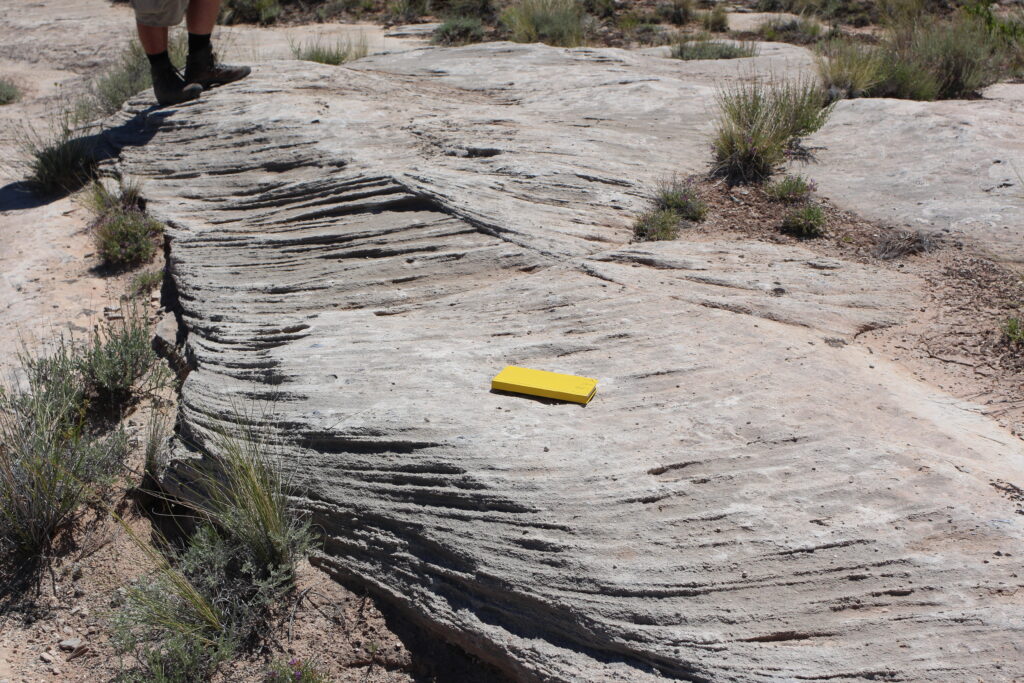
Ancient river deposits that now stand as topographic ridges near Green River, Utah. These are similar to the ones we see from orbit on Mars, and those characterized during my undergraduate research at UT Austin.
Preserved bed-forms from an ancient river that are now a part of a topographic ridge. Detailed study of these outcrops on Earth can shed light on how these features are preserved in the rock record on any planet, and reveal new insights regarding paleo-environmental reconstruction. This photo is also taken near Green River, Utah.

There are similar rocks with way more vegetation around them in Northwest Arkansas where I am currently working as a PhD Candidate.
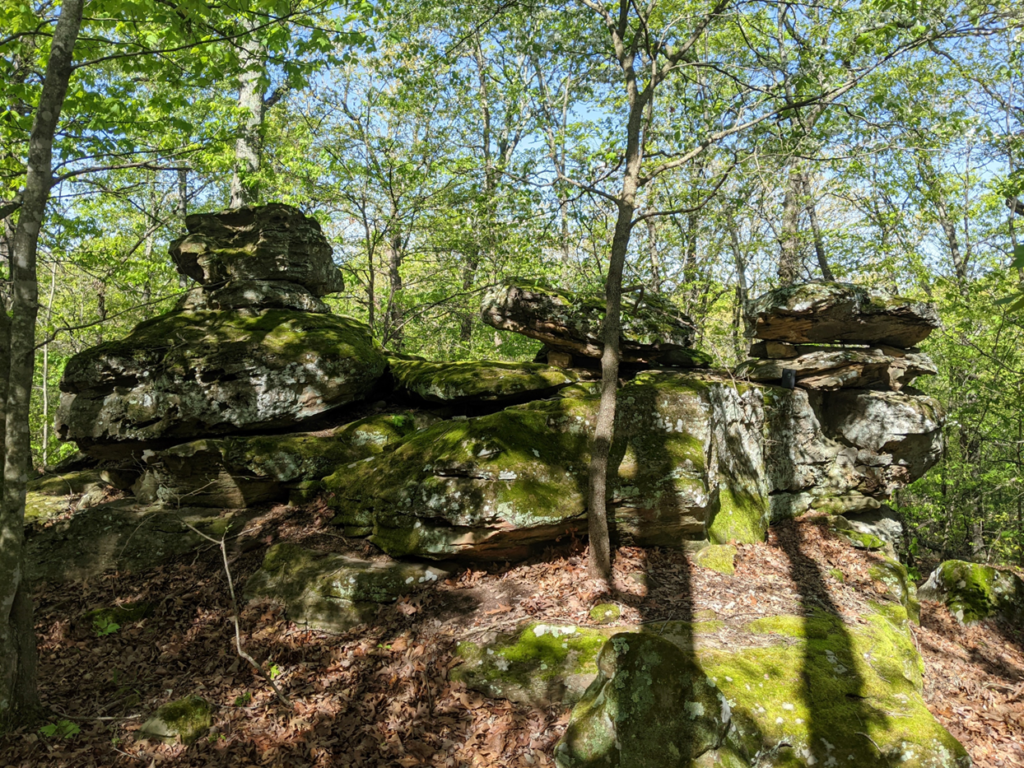
This is a river deposit near Lake Wedington, Arkansas

I have visited an abundance of these deposits around northwest Arkansas, southern Missouri, and northeast Oklahoma. At each location I record measurements that tell me which way the water was flowing, and how deep the rivers were when they were flowing ~300 million years ago!

Here we can see the same ridge networks and river deposits from above using elevation data from a state funded LiDAR dataset.

I then combine remotely sensed data (e.g., LiDAR) with my field observations to build an understanding of the entire river delta system!
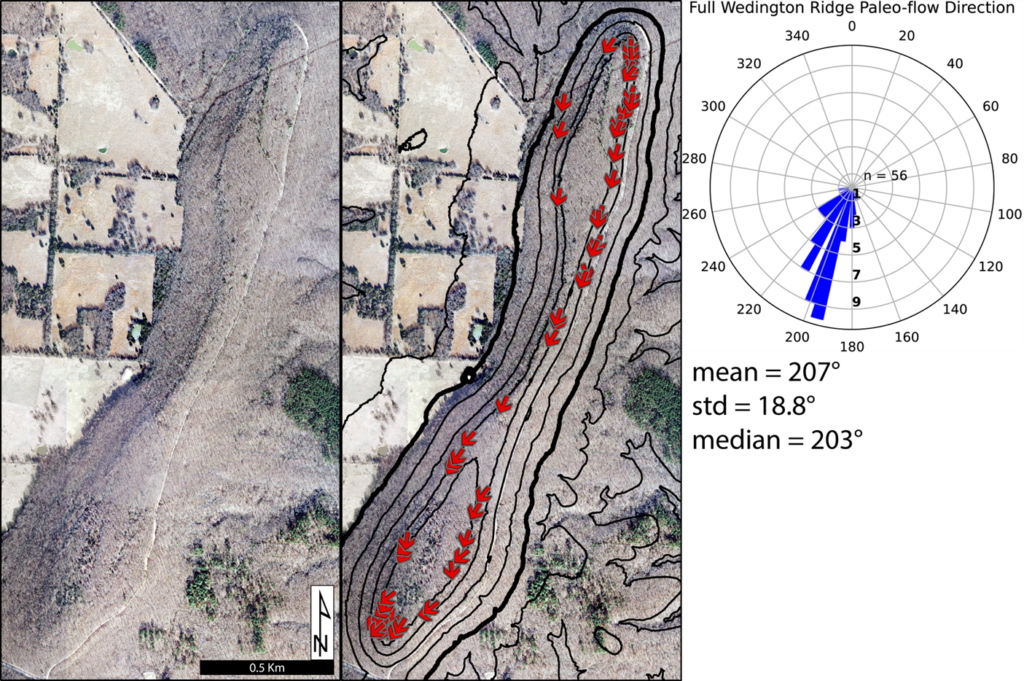
This photo is an aerial image of a particular ridge with flow direction measurements labeled with red arrows. The rose-diagram shows the distribution of measurements.

We analyze the flow direction measurements at a variety of scales, from a single ridge (above) to the entire region (below).

We have used field measurements and LiDAR data to map the network over the entire region.

From this analysis of rocks on Earth we endeavor to learn more about the rocks on Mars.